Module 04 · Revenue Dashboard
One screen that answers
“how are we doing?”
Every metric a revenue manager would ask for, computed the way the industry defines them — and then the two things a static report cannot give you: where you stand against last year, and what the next quarter looks like.
- Metrics
- 20+, industry definitions
- Comparison
- Previous period + last year
- Forecast
- 30 / 60 / 90 days
- History
- Snapshotted over time
The numbers
Correct beats impressive.
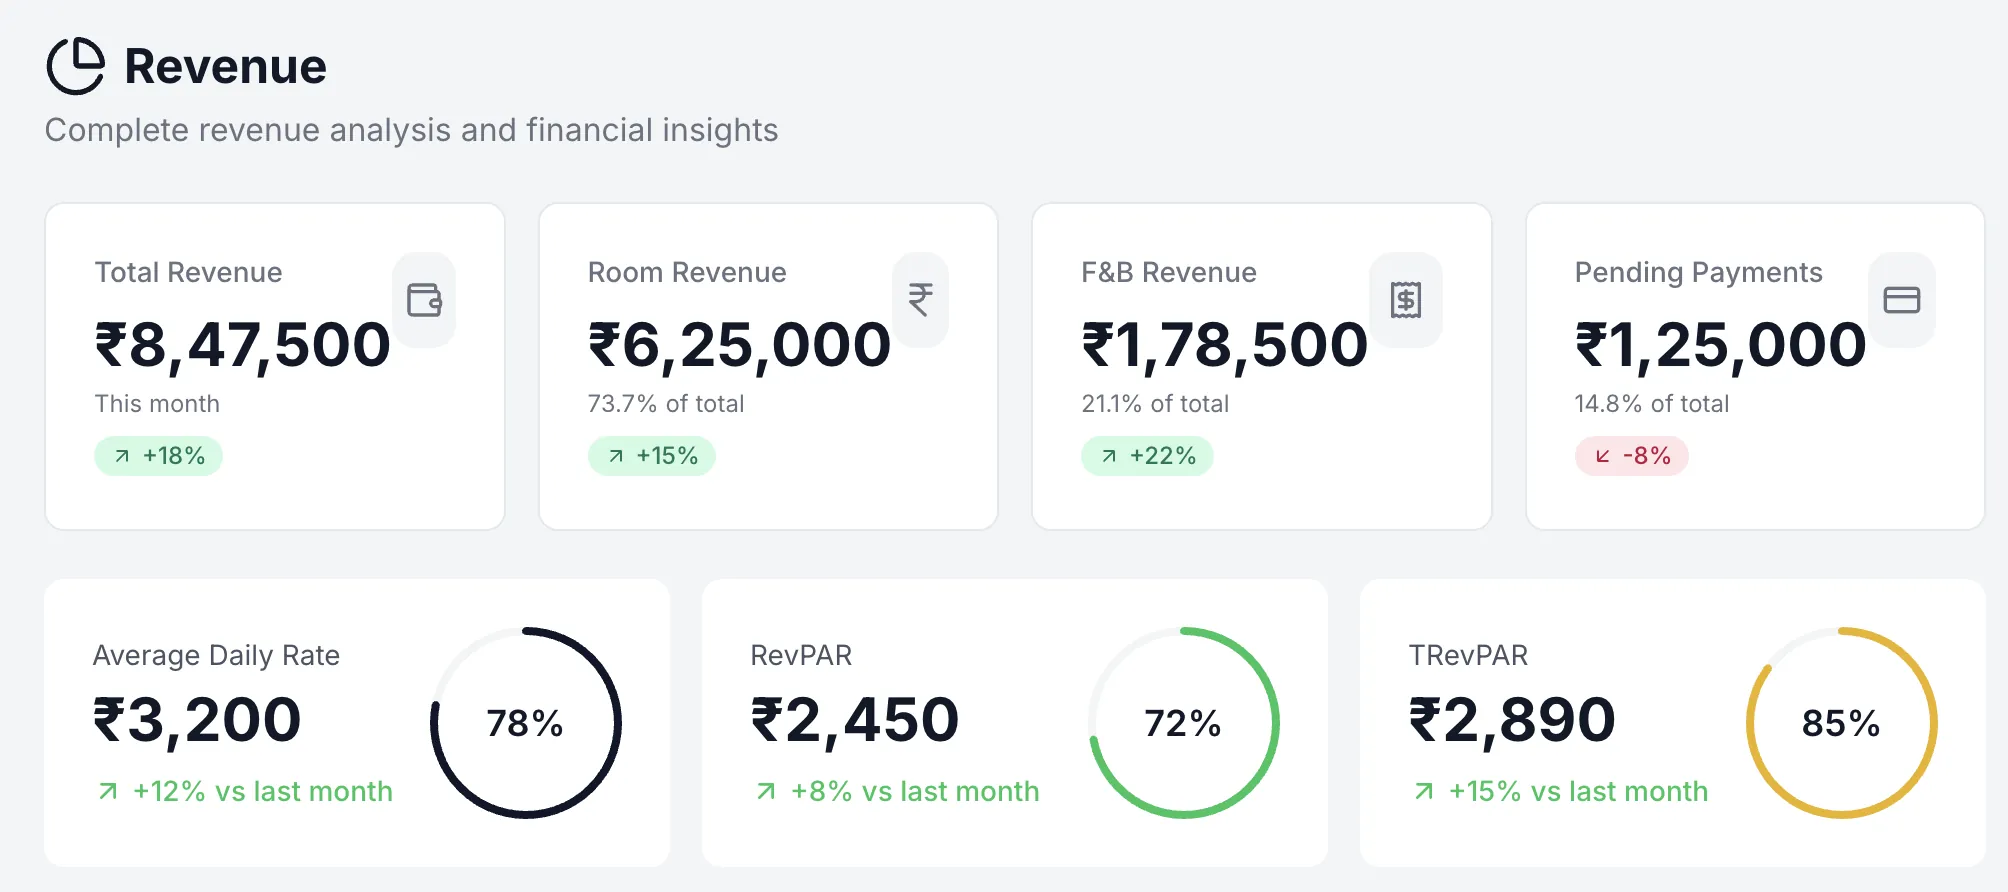
Occupancy and ADR are easy to get subtly wrong — count bookings instead of room nights and a multi-room property's numbers come out several times off. Every figure here is calculated on sold and available room-nights, aware of how many rooms a room type contains, and guarded against division by zero on a quiet period.
Each metric carries its change against the previous period, so the dashboard reads as a direction rather than a snapshot.
- RevPAR
- ₹2,061
- ADR
- ₹3,029
- Occupancy
- 68.1%
- TRevPAR
- ₹2,339
- MPI
- 104
- Direct share
- 41%
+11.4%
+6.2%
+4.8 pts
+9.1%
vs comp set
+7.0 pts
14 points ahead of last year — mostly December weekends already sold.
Historical trends and forecasting
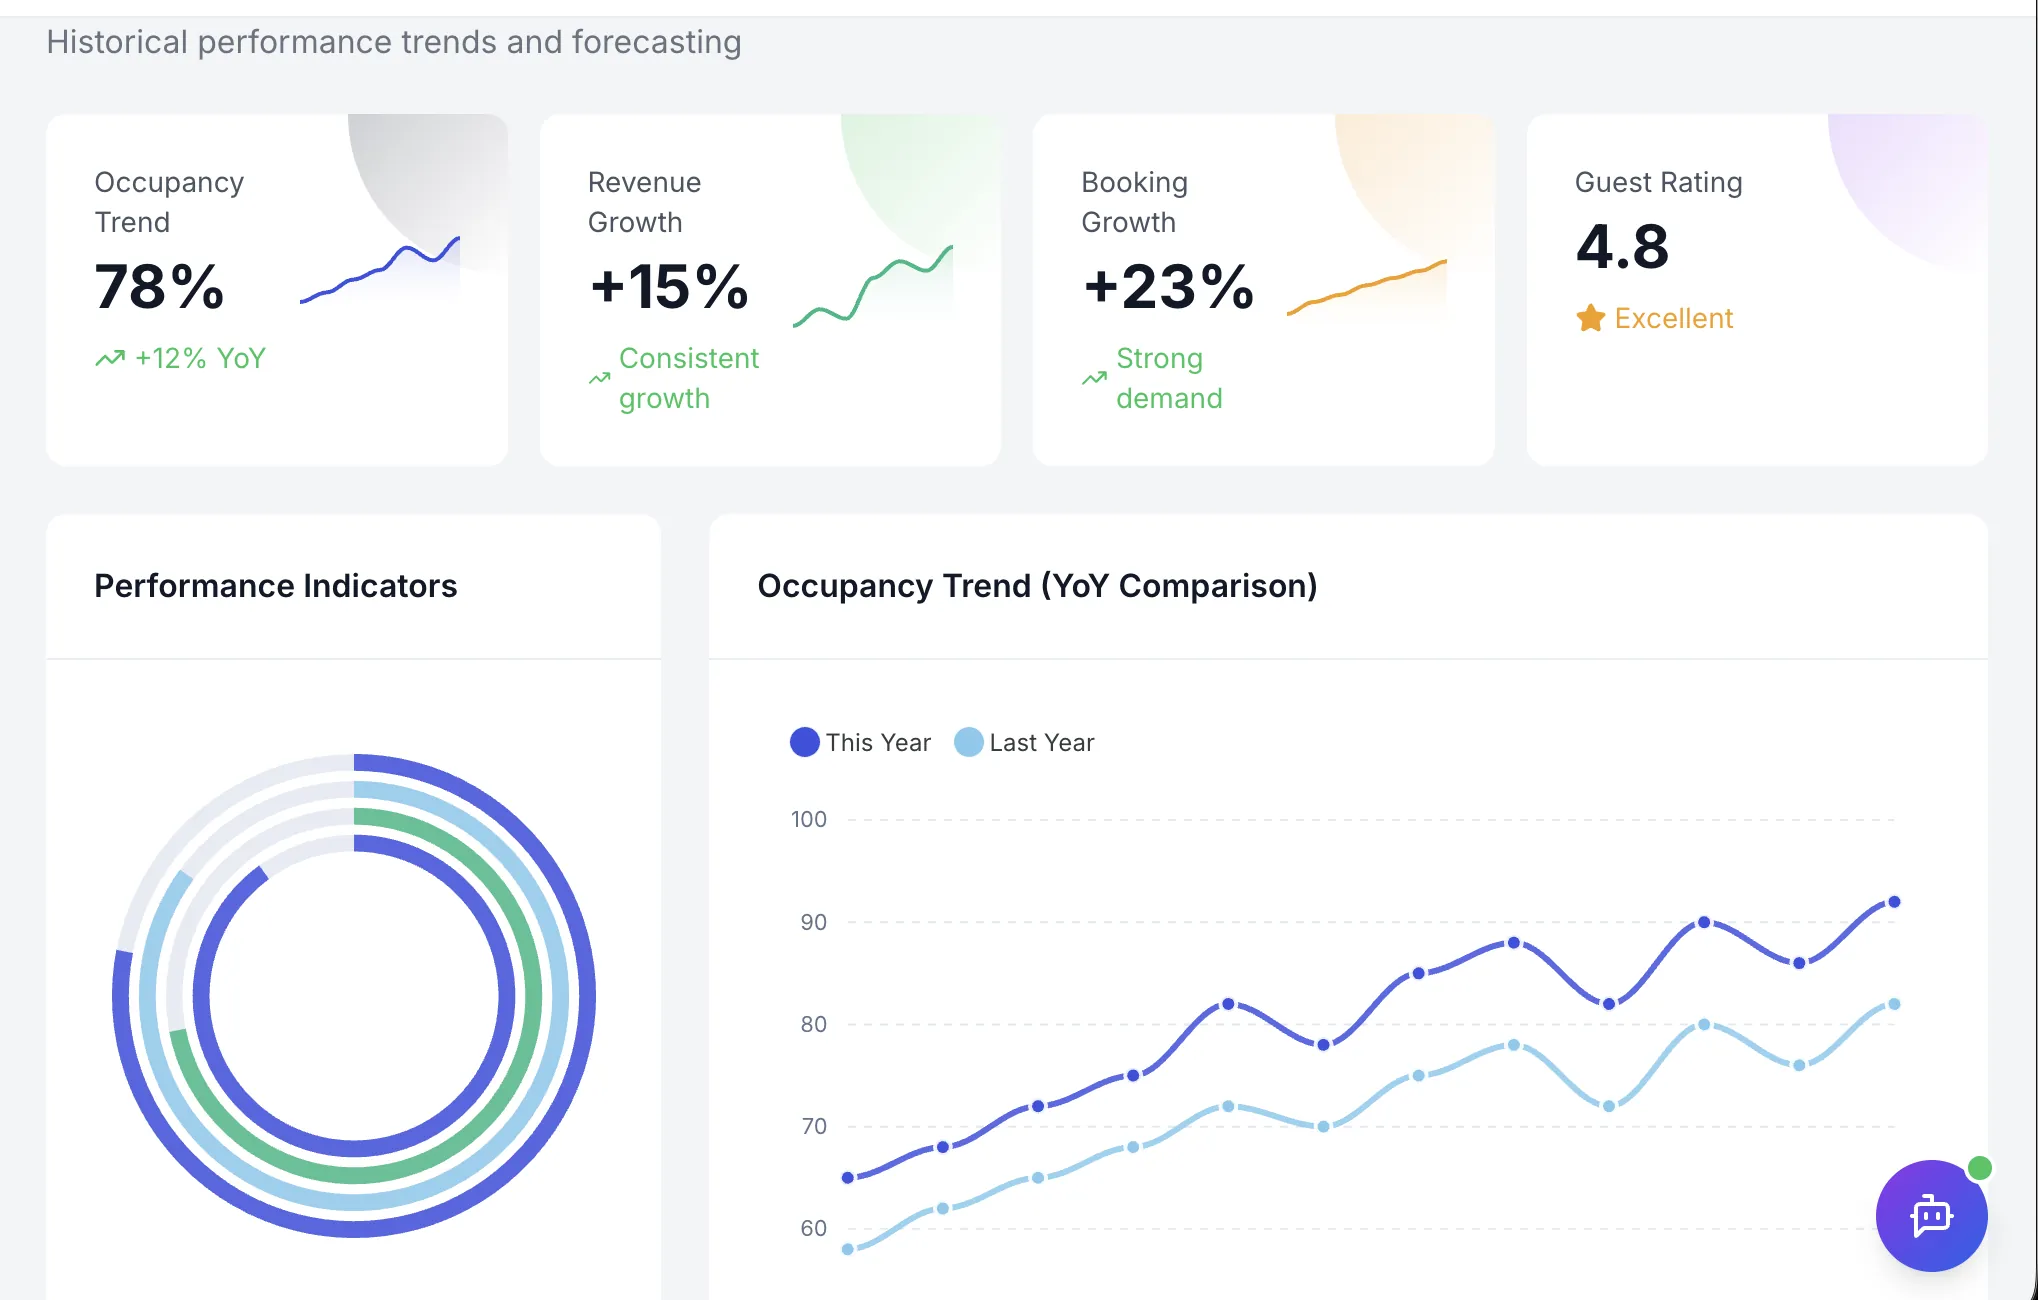
Occupancy trend with its year-on-year change, revenue growth, booking growth and guest rating — then the full occupancy curve for this year against last.
The forward view
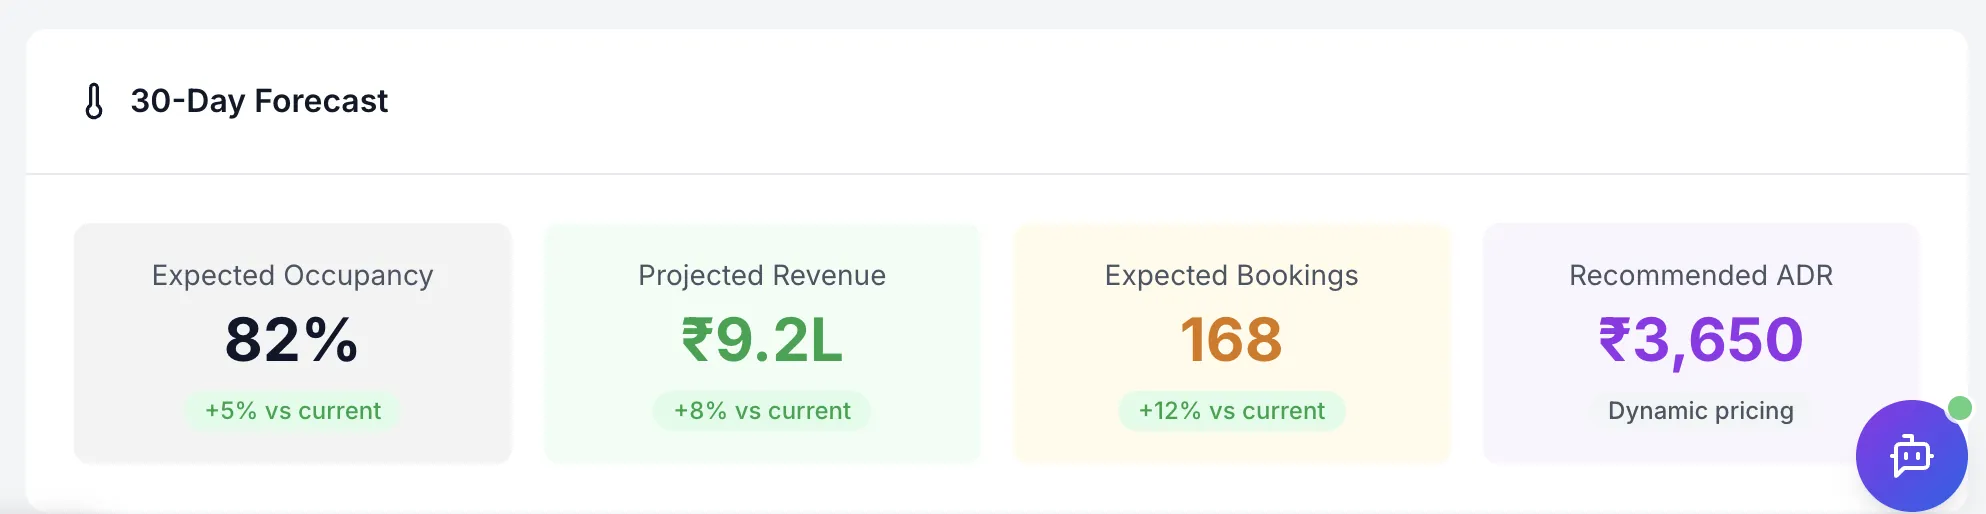
Expected occupancy, projected revenue, expected bookings and a recommended ADR for the next 30 days, each expressed against where you stand now.
Coverage
Everything the dashboard computes.
Grouped the way you actually use them: how the property performed, how guests behaved, and where the revenue came from.
Core performance
- ADR
- Room revenue ÷ sold room-nights
- RevPAR
- Room revenue ÷ available room-nights
- TRevPAR
- Total revenue ÷ available room-nights
- GOPPAR
- Gross operating profit ÷ available room-nights
- Occupancy
- Sold ÷ available room-nights
- MPI
- Your RevPAR against the competitor average
Booking behaviour
- Direct booking ratio
- Direct as a share of confirmed bookings
- Cancellation rate
- Cancelled against all attempted bookings
- No-show rate
- No-shows against confirmed arrivals
- Average lead time
- Days between booking and check-in
- Average length of stay
- Nights per booking
- Booking velocity
- Confirmed bookings per day
Guests and mix
- Repeat guest rate
- Returning guests as a share of unique guests
- Guests per booking
- Average party size
- Channel breakdown
- Bookings, revenue, commission and net by channel
- Room type breakdown
- Revenue, occupancy and ADR per room type
- Day-of-week analysis
- Average occupancy and rate by weekday
- Cancellation reasons
- Ranked, so the fixable ones surface
Low estimate
₹18.4L
Projected
₹24.7L
High estimate
₹31.2L
Confidence band widens as history thins. Data quality: high
avg confidence 81%
Looking forward
A forecast that admits what it doesn't know.
Projected revenue for the next 30, 60 or 90 days, broken down by day, week, month and room type. Every projection carries a low and high estimate — and the band gets wider the further out it goes, because that is the truth of it.
The forecast is graded on data quality — high, medium or low — so you know whether to plan against it or merely note it. Set a monthly revenue target and the dashboard also shows whether you are on track and by how much you are short.
Target tracking
Projected monthly revenue against your target, with the gap stated in rupees and in percent.
Room-type projections
Which room types carry the forecast, so a soft month can be traced to a specific inventory problem.
Pace against last year
Bookings on the books for the coming window versus the same window last year — the earliest warning available.
Metric snapshots
Periodic snapshots build a real history, so trends are read from stored fact rather than recomputed guesswork.
Market Performance Index
Good numbers, or just a good market?
RevPAR up 11% is only good news if the market did not rise 20%. MPI puts your performance against the comp-set average that myEDGE AI collects: 100 is par, above 100 means you are taking more than your share, below means the market is carrying you.
Because the comparison is only as good as the competitor data behind it, MPI is shown with its source, a confidence figure, the age of the data, and a flag when it has gone stale. A number with no data behind it is shown as unavailable rather than filled in.
Questions
Revenue metrics, explained
- What is the difference between ADR, RevPAR and TRevPAR?
- ADR is room revenue divided by room-nights actually sold — the average price of a sold room. RevPAR is room revenue divided by room-nights available, so it captures both rate and occupancy. TRevPAR does the same with total revenue including food and beverage and other ancillary income.
- What is a good RevPAR for an Indian property?
- There is no universal figure — it depends on location, segment and season. That is why the dashboard shows RevPAR against your own previous period and against the market rather than against a benchmark table, and why the Market Performance Index exists at all.
- How far ahead does the forecast go?
- Thirty, sixty or ninety days, with a low and high estimate around each projection and a data-quality grade. The band widens the further out it goes, because that is the truth of forecasting a booking window that has not opened yet.
- Does the dashboard replace my PMS reports?
- It replaces the spreadsheet you build from them. myrevai is an analysis layer — it reads booking data from your PMS or channel manager and computes the metrics to their industry definitions, but it does not take reservations or hold inventory.
See your last 90 days, computed properly.
Most owners find at least one metric they had been reading wrong. We will run your history through the dashboard and walk you through what changes.