Module 05 · Profit Analysis
Revenue is a headline.
Profit is the business.
A record month on OTAs can leave less in the account than a quieter one sold direct. Profit Analysis walks the same period the dashboard measures all the way down — commission, fees, operating cost — and shows what survived.
- View
- Gross → net waterfall
- Ratios
- GOPPAR · CPOR · NRevPAR
- Cuts
- By channel and room type
- Range
- 30 days · 90 days · 12 months
The waterfall
Four subtractions between the top line and the bank.
Gross revenue, minus OTA commission, minus platform fees, minus operating cost, equals net profit — with the margin stated as a percentage. Each step is sized so you can see instantly which one is doing the damage.
For most independent properties, the surprise is not the operating cost. It is the commission line, which never appears on a booking confirmation and rarely appears on a monthly summary.
- GOPPAR — profit per available room-night, the metric that survives comparison across properties.
- CPOR — what an occupied room actually costs to deliver.
- NRevPAR — revenue per available room after commission, the honest version of RevPAR.
- Profit margin, tracked period over period rather than quoted once.
GOPPAR
₹872
CPOR
₹1,704
NRevPAR
₹2,049
Collections
Profit assumes the money arrived.
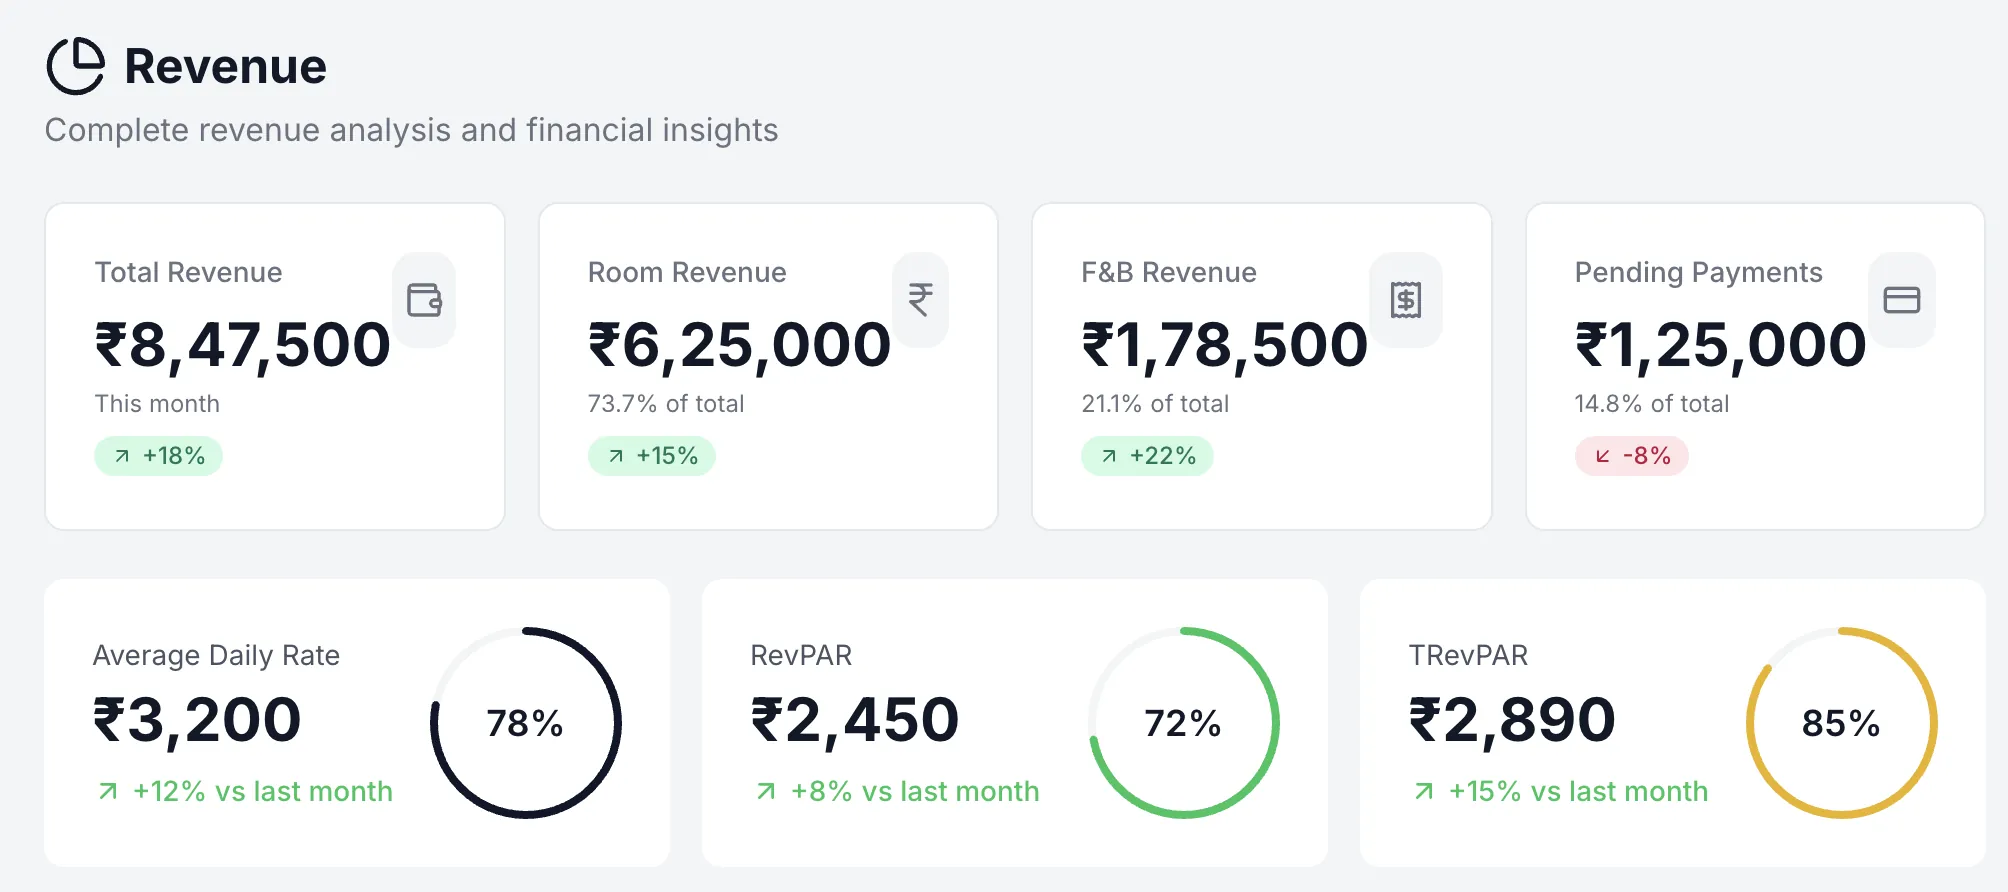
A margin calculated on invoiced revenue is optimistic if a seventh of it is still outstanding. Pending payments sit on the same screen as the revenue they belong to, so the gap between booked and banked is visible rather than assumed away.
Ancillary revenue is separated from room revenue for the same reason. F&B carries a different cost base, so folding it into ADR flatters both numbers.
Commission saved by direct bookings this period: ₹55,200
Channel margin
The channel that books the most is rarely the one that pays the most.
Every channel is shown three times: what it grossed, what it cost in commission, and what it left behind. A channel at 18% take needs to bring meaningfully more volume than your direct site to be worth the same to you — and now you can see whether it does.
The module also totals commission saved through direct bookings, which is usually the clearest argument for whatever you are spending on your own booking page.
Commission, itemised
Per channel and in total, at the rate each OTA actually charges you rather than a blended assumption.
Mix over time
Whether your direct share is genuinely growing, or simply moving between OTAs.
Room-type profitability
Which rooms carry the property. Revenue ranking and profit ranking are often not the same list.
Monthly profit trend
Twelve months of margin, so a seasonal dip is distinguishable from a structural one.
Honesty about estimates
Labelled as estimated, until you tell us otherwise.
Commission and platform fees are known exactly — they come from your bookings. Operating cost usually does not exist in any system on day one, so the module starts with a cost-per-occupied-room estimate scaled to your property size, and marks every figure that depends on it.
As you enter real costs — housekeeping, utilities, staff, food and beverage — the estimates are replaced and the labels come off. Nothing is presented as measured when it was inferred.
Gross revenue
measuredRoom revenue plus ancillary revenue — meals, extras and charges raised during the stay.
OTA commissions
measuredThe commission recorded against each booking, per channel.
Platform fees
measuredPayment and platform charges on direct booking revenue.
Operating costs
estimatedCost per occupied room × sold room-nights, until real cost data replaces the estimate.
Net profit
estimatedWhat remains, and the margin it represents on gross revenue.
Figures shown across this site are illustrative. Yours are computed from your own bookings.
Closing the loop
Profit is where pricing decisions get graded.
A rate increase that pushes guests onto a higher-commission channel can raise revenue and lower profit. A discount that fills a monsoon Tuesday might be the most profitable decision of the month once you count the cost of an empty room at zero revenue and non-zero fixed cost.
Because Profit Analysis, the Revenue Dashboard and aiREV all read the same booking data, you can follow a pricing decision from recommendation to applied rate to realised margin without reconciling three different reports.
Same period. Same data. Two questions: what did we make, and what did we keep?
Questions
Profit metrics, explained
- What is GOPPAR and why does it matter more than RevPAR?
- GOPPAR is gross operating profit divided by available room-nights. RevPAR tells you how much revenue each available room earned; GOPPAR tells you how much of it you kept. Two properties with identical RevPAR can have very different GOPPAR once commission and operating cost are subtracted.
- What is CPOR?
- Cost per occupied room — what it actually costs to deliver one sold room-night, covering housekeeping, utilities, amenities and the variable share of staffing. It is the figure that tells you whether a discounted night is still worth selling.
- How does myrevai calculate OTA commission?
- From the commission recorded against each booking, per channel, at the rate that channel actually charges you — not a blended assumption. The module also totals the commission your direct bookings saved you over the period.
- Do I need to enter my costs before this is useful?
- No, but it improves. Commission and platform fees are known exactly from your bookings. Operating cost starts as an estimate scaled to your property size and every figure depending on it is labelled estimated until you enter real costs.
Find out what last quarter actually earned you.
Send us a booking export with channel and commission data. We will produce the waterfall, the channel margin table and the room-type ranking, and walk you through what they say.