Module 02 · myEDGE AI
Know the market before
you price against it.
myEDGE AI finds the properties you actually compete with, reads what they are charging for the period you care about, and turns it into a position you can act on — then hands the result to aiREV as a pricing signal.
- Comp set
- Up to 15 properties per location
- Sources
- Multiple online travel sources
- Periods
- This week → next month
- History
- 12 months of patterns
The comp set
Real properties, real rates, your dates.
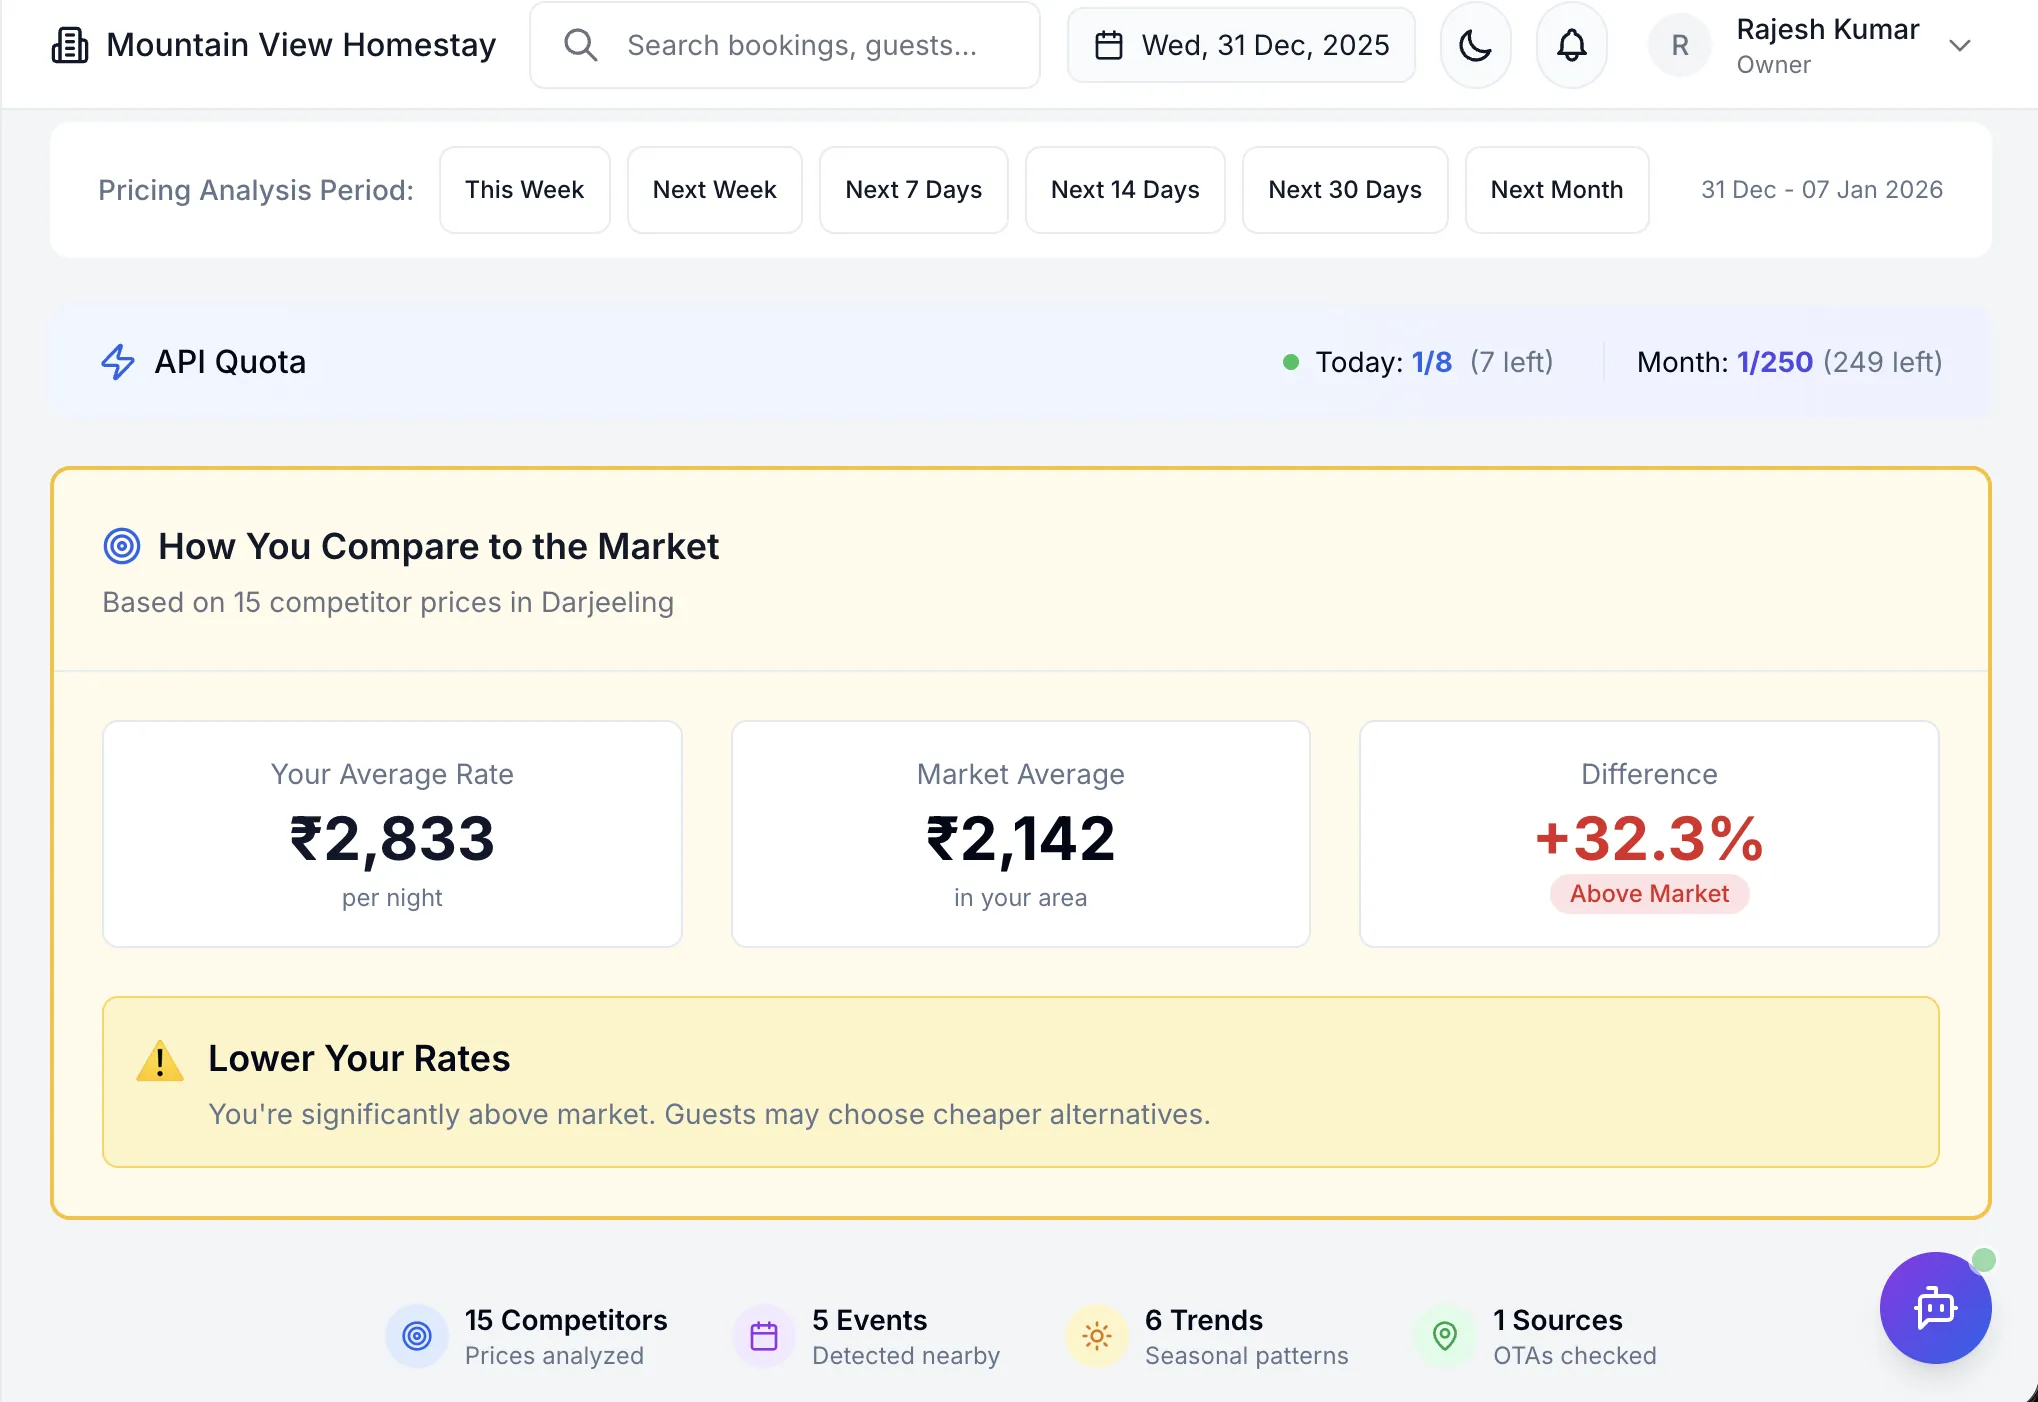
Not a market average from a report six months old. myEDGE discovers similar properties around you by location, reads their live nightly rates across multiple online travel sources, and builds a comparison of up to fifteen comparable properties for the exact period you select.
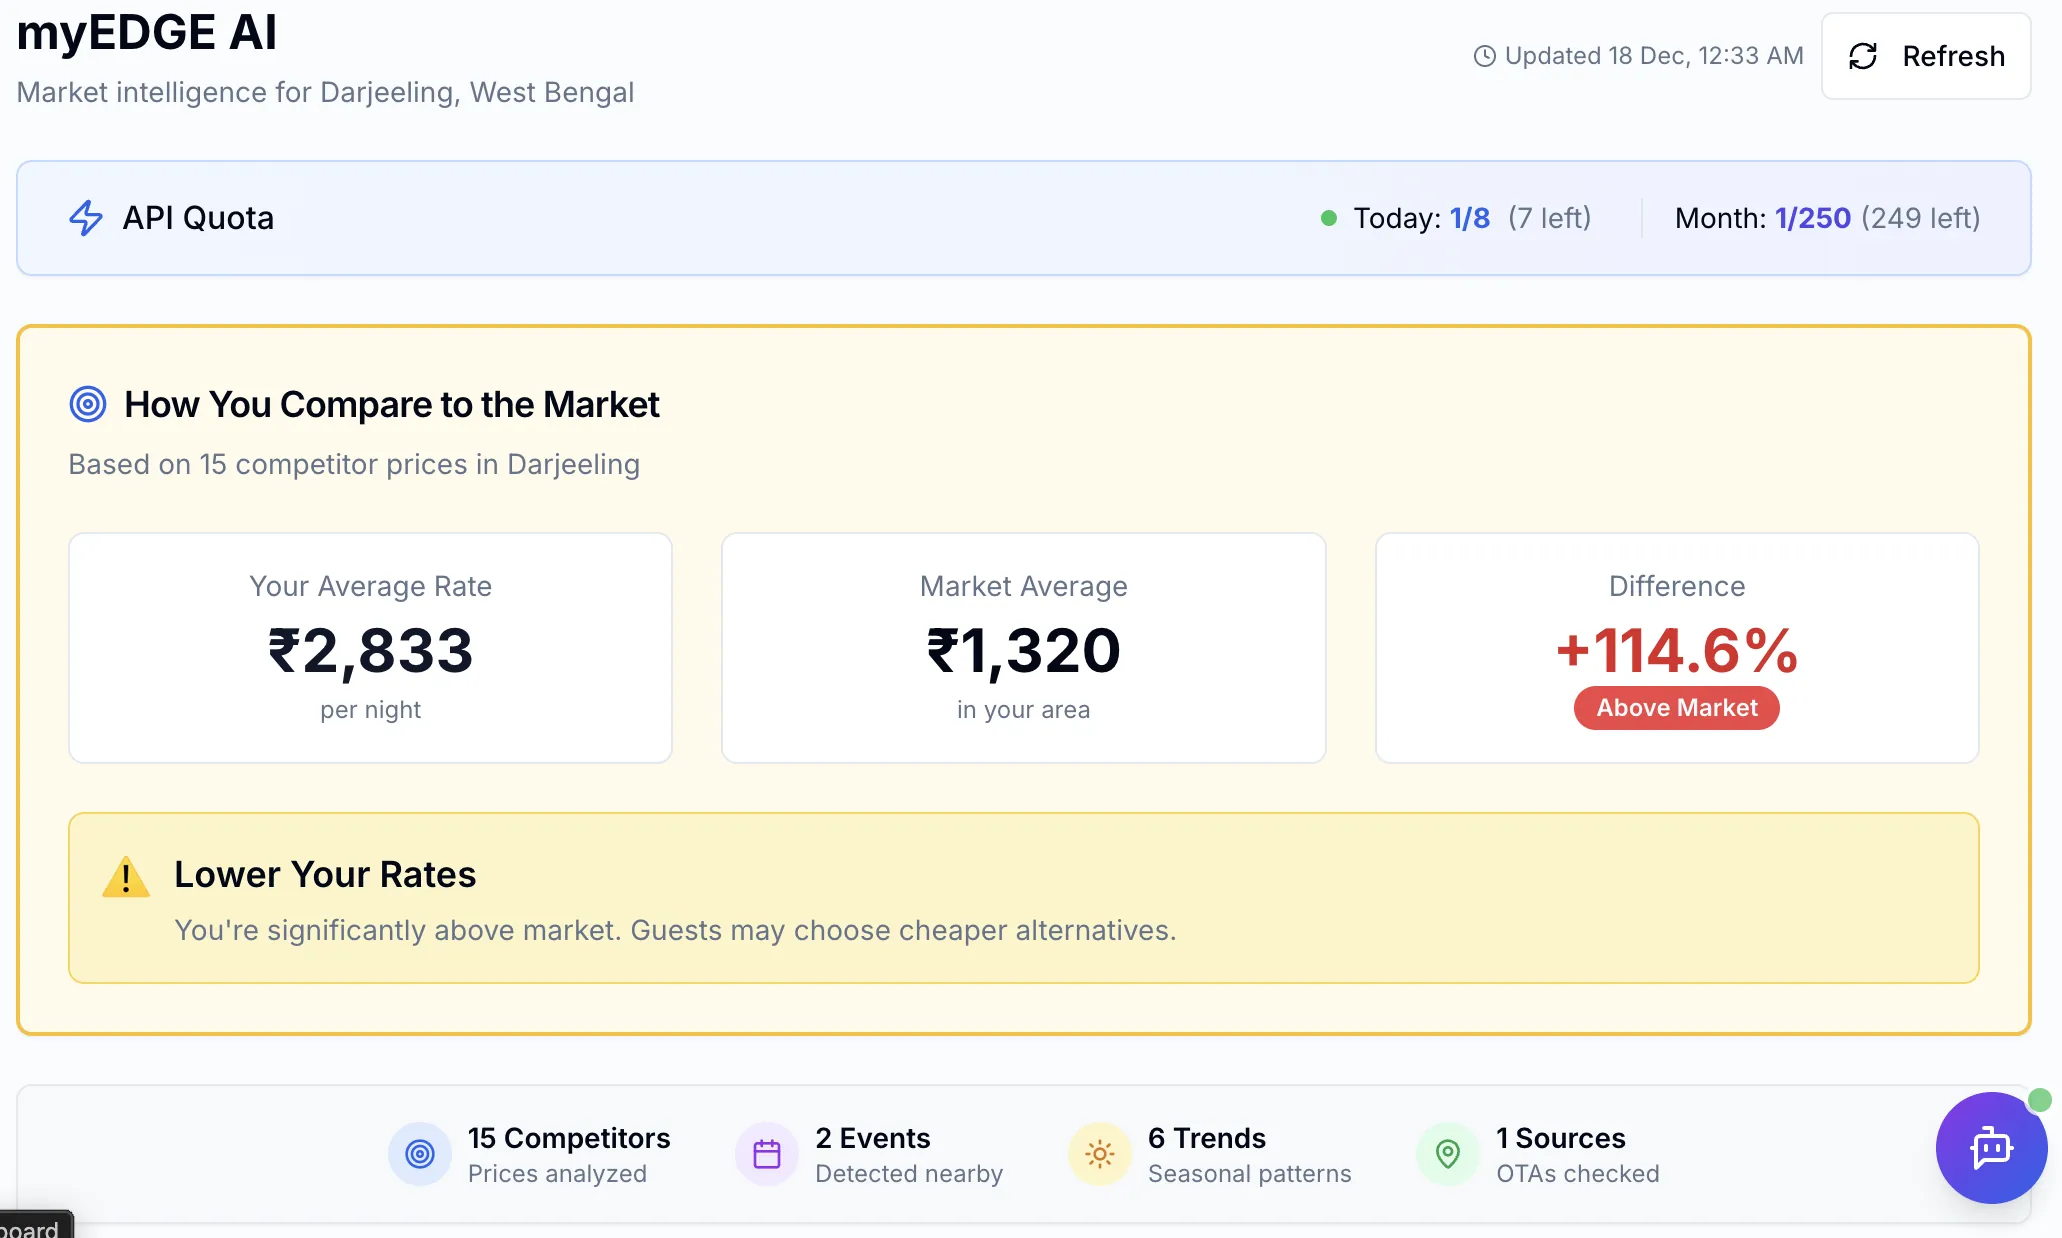
The result is not a chart to interpret. It is a verdict: your average rate, the market average, the difference as a percentage, and the action it implies — hold, lift, or come down.
- Market average and full price range, so an outlier never reads as the market.
- Every comparable property listed with its nightly rate — nothing hidden behind an index.
- A data-confidence percentage, from how many price points were found and how fresh they are.
- Refresh quota shown in the header — you always know what a refresh costs before you spend it.
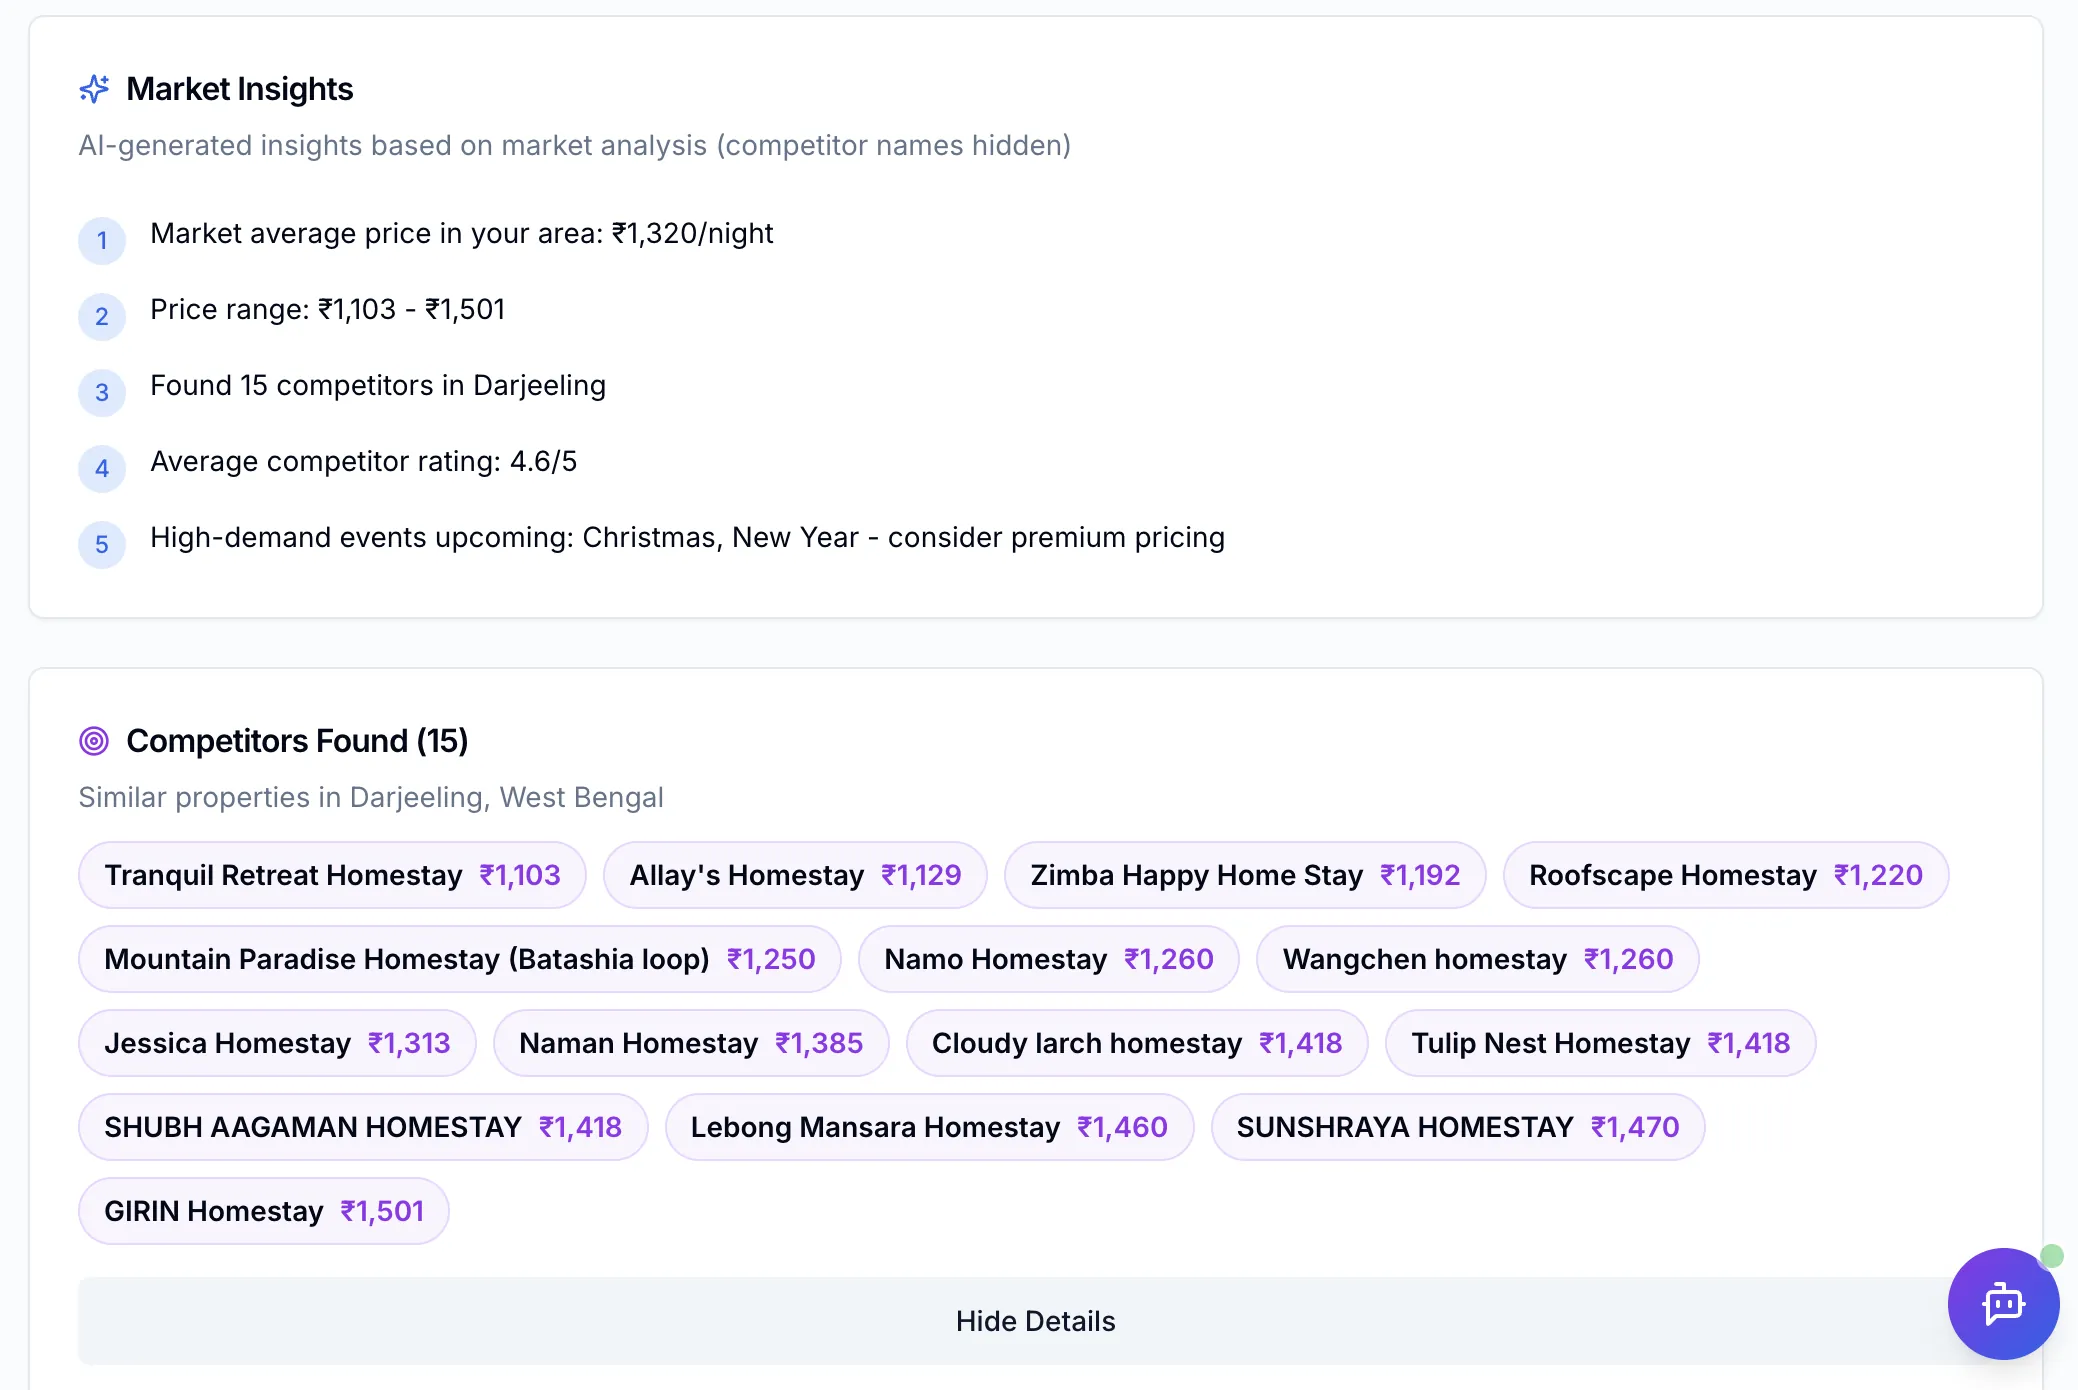
Market insights & competitor list
AI-generated read of the market — average price, the price range, how many competitors were found, their average rating and the high-demand events coming — then every comparable property with its nightly rate.
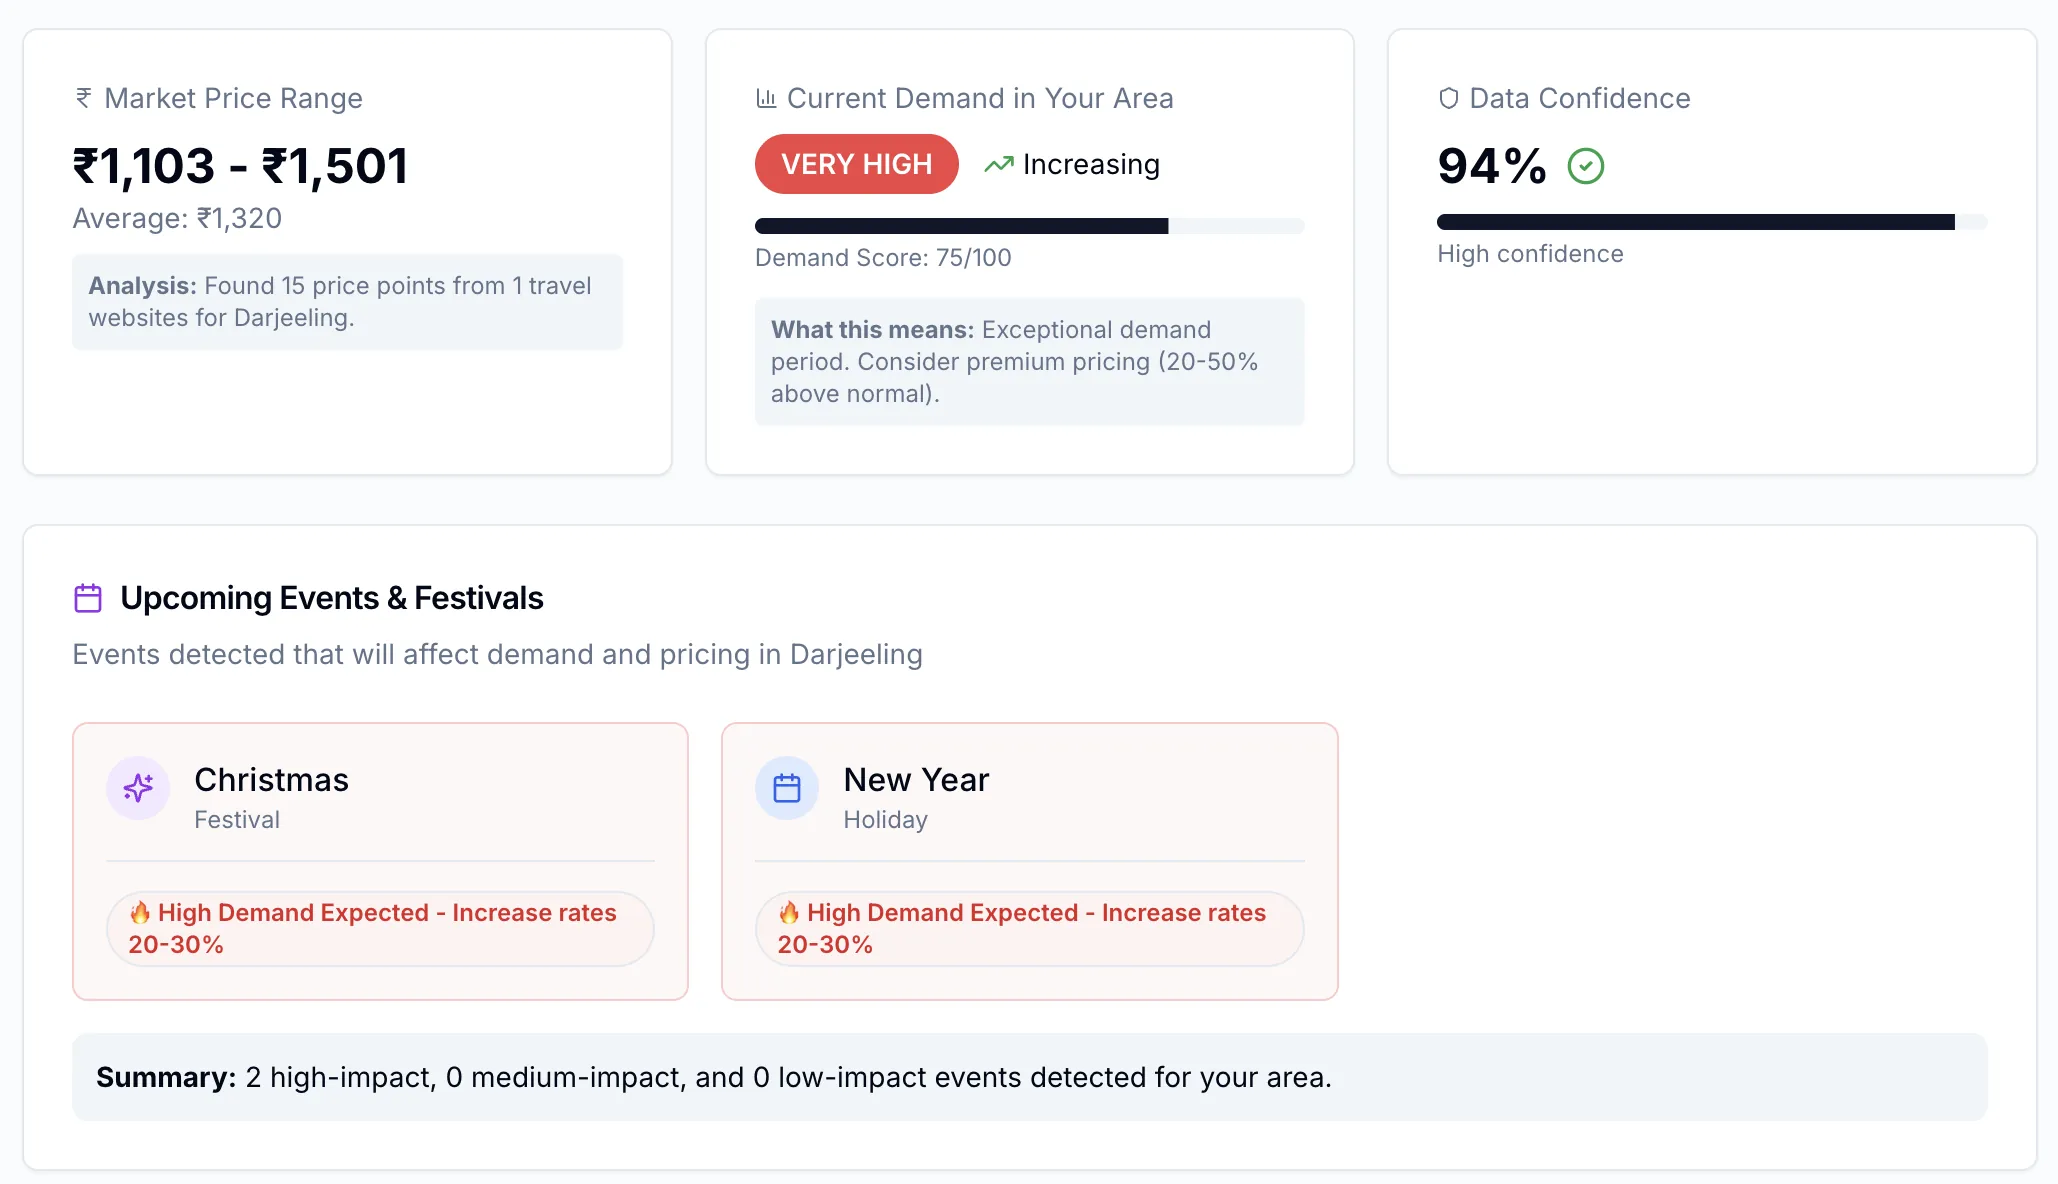
Demand score & events
Market price range, a 0–100 demand score with what it means for pricing, a data-confidence figure, and the festivals and holidays detected nearby with the uplift each one supports.
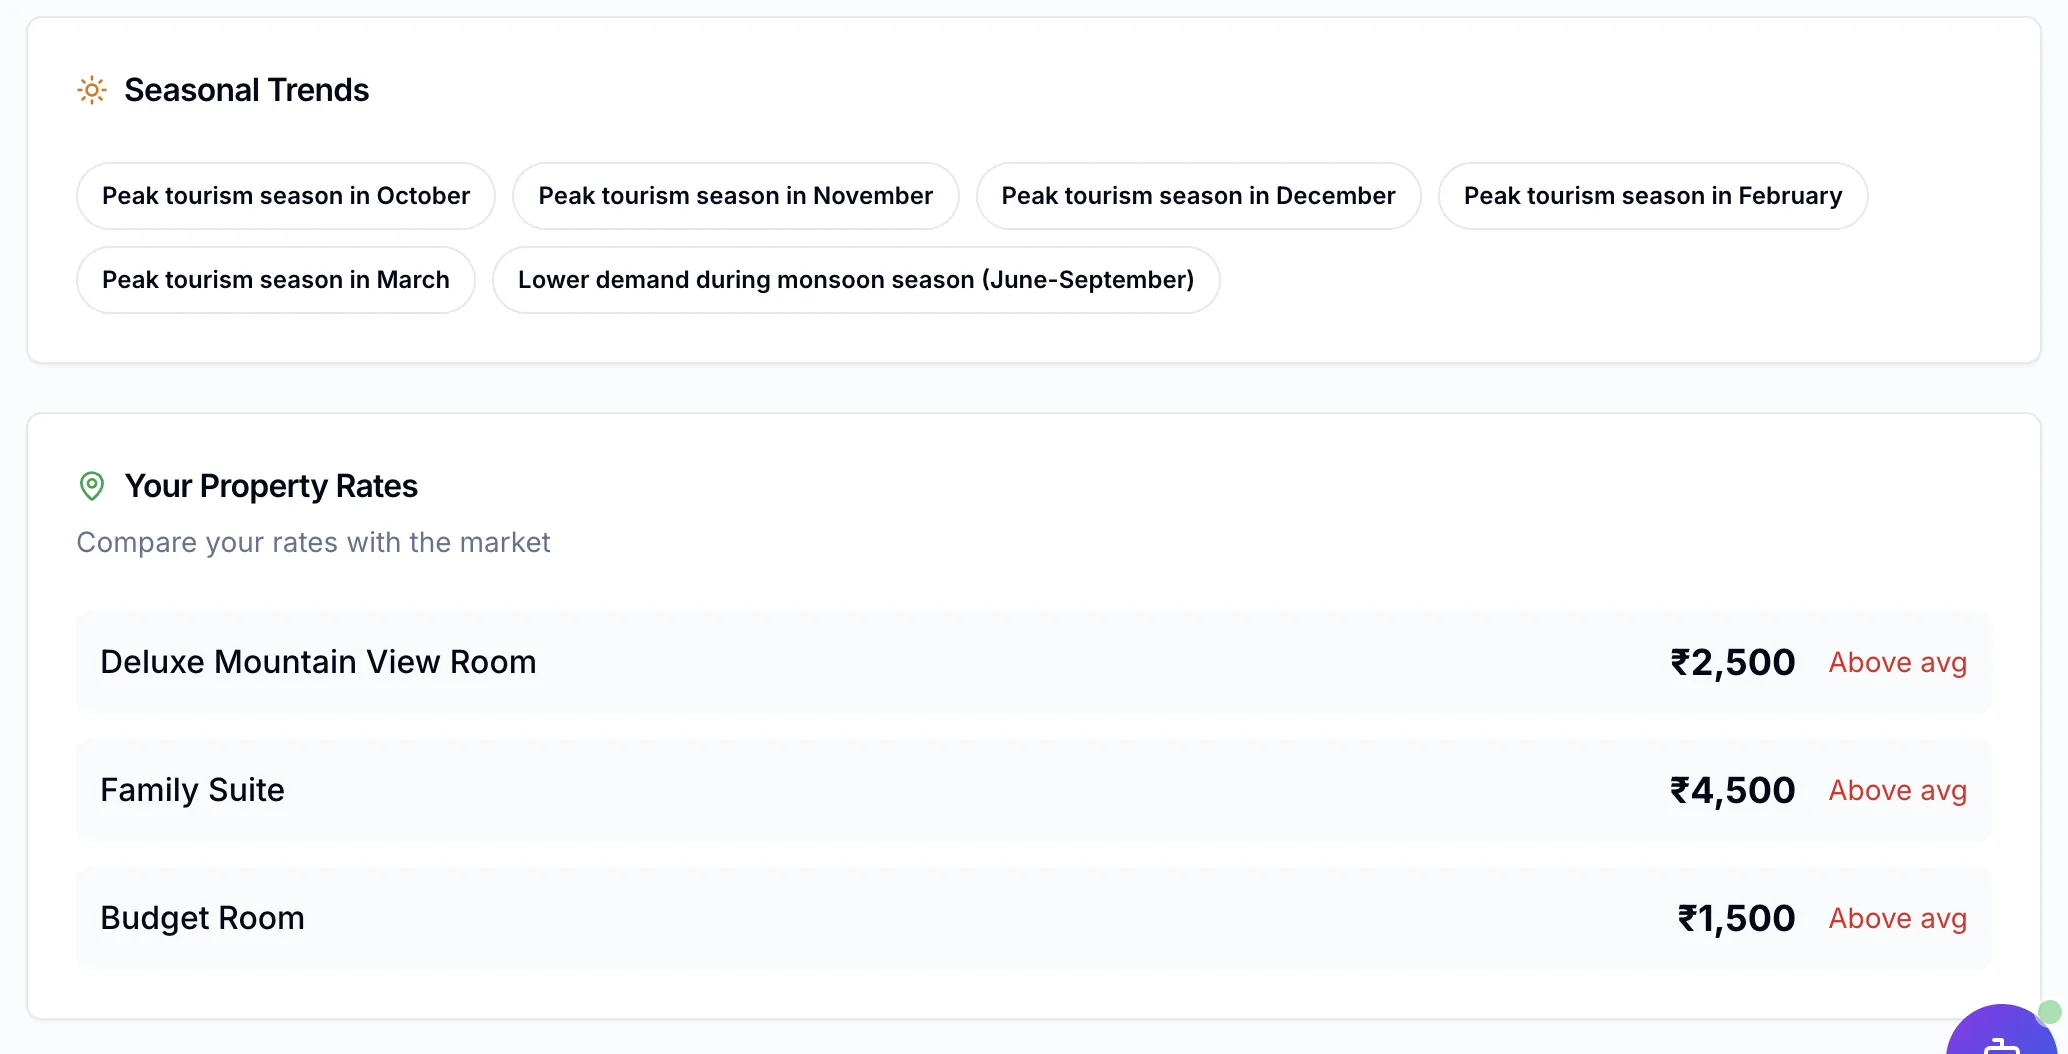
Seasonal trends & your rates
The seasonal pattern for your location — peak months and the monsoon trough — with each of your room types marked above or below the market average.
What gets captured
Six signals per refresh, not just a price.
A rate on its own is a weak signal. A rate next to the market range, the demand score, the events coming and a confidence figure is a position you can act on.
- Nightly rate
- What each comparable property is quoting for the period you selected — the number a guest actually sees.
- Market average and range
- The average for your area and the full spread from cheapest to dearest, so an outlier does not read as the market.
- Guest rating
- Average competitor rating, so a rate gap can be read against a quality gap rather than in isolation.
- Demand score
- A 0–100 read on how hot your area is right now, with the direction of travel and what it implies for pricing.
- Events and festivals
- What is coming near the property, classified by impact, with the uplift each one supports.
- Data confidence
- How much to trust the comparison — stated as a percentage, from how many price points were found and how fresh they are.
What myEDGE produces
Four reports, refreshed together.
Competitive position
Your average rate against the market average for your area, the difference as a percentage, a plain above/at/below-market verdict, and the action it implies.
Market insights and competitor list
An AI read of the market — average price, price range, how many comparable properties were found and their average rating — followed by every one of them with its nightly rate.
Demand score and event strategy
A 0–100 demand score with its direction and what it means for pricing, plus the festivals and holidays detected nearby, each classified by impact with the uplift it supports.
Seasonal trends and rate comparison
The seasonal pattern for your location — which months peak, when the monsoon takes demand out — with each of your own room types marked above or below the market.
Analysis periods
The market is not one number. It depends when you ask.
A comp set for next weekend and a comp set for next month are different markets. myEDGE runs the comparison against the window you choose, so a festival period is never averaged away against the quiet fortnight beside it.
Behind those windows sit the patterns that repeat: weekday against weekend, week over week, festival periods such as Diwali, Holi and Christmas, long weekends, and peak, shoulder and off-peak seasons — read against twelve months of history.
Positioning strategy
Decide where you want to sit, then hold it deliberately.
Knowing the market average is only useful once you have decided what to do about it. myEDGE frames the choice as three explicit strategies rather than leaving you to infer one.
10–30% above market
Premium positioning
Price above the market when your amenities and service justify it. Attracts quality-focused guests and lifts RevPAR.
Aligned to market
Market match
Hold the market rate and win on reviews and experience. Balanced occupancy, steady bookings.
5–15% below market
Value leadership
Price under the market to fill rooms and build volume. Highest occupancy, revenue from throughput.
Quota discipline
Live data is expensive. We treat it that way.
Every comp-set refresh costs real money — one listing query plus a detail query per competitor. myEDGE caches results for seven days per city, enforces a daily and a monthly ceiling, and counts against the calls actually recorded rather than a proxy that undercounts them.
The remaining quota is shown in the dashboard, not hidden in a config file. When it is low, you know before you spend it.
Monthly refresh budget
Shared account ceiling
Daily ceiling
Prevents a single day draining the month
Cost per refresh
1 listing + 5 competitor detail lookups
Cache lifetime
Repeat views are free
How it connects
myEDGE is a signal, not an island.
Competitive intelligence that only lives on its own screen changes nothing. Here is where it lands.
Into aiREV
The comp-set average becomes the competitor multiplier in tomorrow's rate recommendations, clamped to ±20%.
Into the dashboard
Market Performance Index compares your RevPAR against the competitor average, with a confidence figure and a staleness flag.
Through currency
Some sources quote in USD. Exchange rates are fetched and cached, so a market average is never a mixed-currency mistake.
On a schedule
Market data refreshes each morning, ahead of the daily pricing analysis that consumes it.
Questions
Competitor rate intelligence, explained
- What is competitor rate intelligence for hotels and homestays?
- It is the practice of tracking what comparable properties near you are charging, for the dates you care about, so your own pricing is a decision rather than a guess. myEDGE AI does this automatically: it discovers similar properties by location, reads their live nightly rates from multiple online travel sources, and reports where you sit against the market.
- Which properties does myEDGE benchmark me against?
- Comparable properties discovered by location — up to fifteen per area. They are similar in type and segment rather than simply the nearest addresses, and every one that contributes to the average is listed with its nightly rate, so you can see exactly what the comparison is built on.
- How often does myEDGE refresh competitor data?
- On demand, within a published quota that is shown in the dashboard header rather than buried in settings. Refreshes are cached so repeat views cost nothing, and you always see how much of the daily and monthly allowance is left before you spend it.
- How is myEDGE different from a dynamic pricing engine?
- myEDGE observes; aiREV decides. myEDGE reports the market average, the price range, the demand score and the events approaching. aiREV takes that as one of six pricing signals and turns it into a suggested rate. You can use myEDGE on its own as market intelligence.
- Is competitor intelligence useful for a small property?
- Often more so. A large hotel has a revenue manager watching the market daily; a 10-key property does not, which is exactly why its rate card tends to sit unchanged through a festival week while everyone nearby moves.
See your comp set before you sign anything.
Tell us the property and the city. We will show you the five competitors myEDGE picks, what they are charging this weekend, and where that puts you.